
Summary
- By many popular metrics, Riot is below par.
- Often used measures indicate that the company is of poor value.
- Profitability leaves a lot to be desired.
- Other Bitcoin miners offer a better alternative.

Preamble
Being an old fogy, I arrived at the bitcoin party a little late because I was firmly in the bitcoin-is-a scam camp. My mind was changed by an acquaintance who explained that rather like sound money, bitcoin records a transaction. If I were to buy a cow, then the money I pay to the vendor would act as confirmation of my purchase. Bitcoin devotees will understand that it is the same principle with the blockchain technology that is the basis of Bitcoin.
Over the years, Bitcoin has received some bad press from various quarters. For instance, Charlie Munger describes the crypto king in very coarse terms. Whilst I disagree with Mr. Munger, I do agree with Warren Buffett when he states that a single Bitcoin is a non-productive asset and will not produce lots of little Bitcoins. So, rather than buy Bitcoin, I have instead invested in a Bitcoin miner. To this end, I carried out some research in an effort to find the best investment, a summary of updated results of previous findings is given in this article.
Background
Evaluating miners, whether they be miners of commodities such as gold, or Bitcoin is entirely different from appraising many other providers of products or services. Since all of the miners produce Bitcoin, there is no need to figure out market share or customer penetration rates, and the process of mining is fairly similar. Also, since these digital currency miners are in a high growth phase, commonly used ratios such as price-to-earnings (P/E) or value-to sales multiples are of negligible consequence. The likes of P/E ratios provide little insight into what drives valuation nor are they able to account for the characteristics of an individual company.
For this comparison, I believe ratios that offer an insight into profitability and management effectiveness are best to give a forward indication of future cash flow growth. However, I will begin with a couple of relative value ratios. Also, please note that all figures used to calculate the ratios are in millions.
Value
One often-used measure employed to weigh one company against another is the price to sales (P/S) ratio. For this, it is a straightforward matter of dividing the market capitalization of a company by the revenue. Rather than take the annual revenue for the companies, I have calculated the revenue over the last 4 quarters and used the market cap at the time of writing. Of course, for this particular ratio, the lower the number the better.
As you may see from the bar chart, using this ratio, both Marathon (NASDAQ:MARA) and Riot (NASDAQ:RIOT) offer the least value relative to Bitfarms (NASDAQ:BITF) and HIVE (NASDAQ:HIVE) whilst Hut 8 (NASDAQ:HUT) is in the middle.
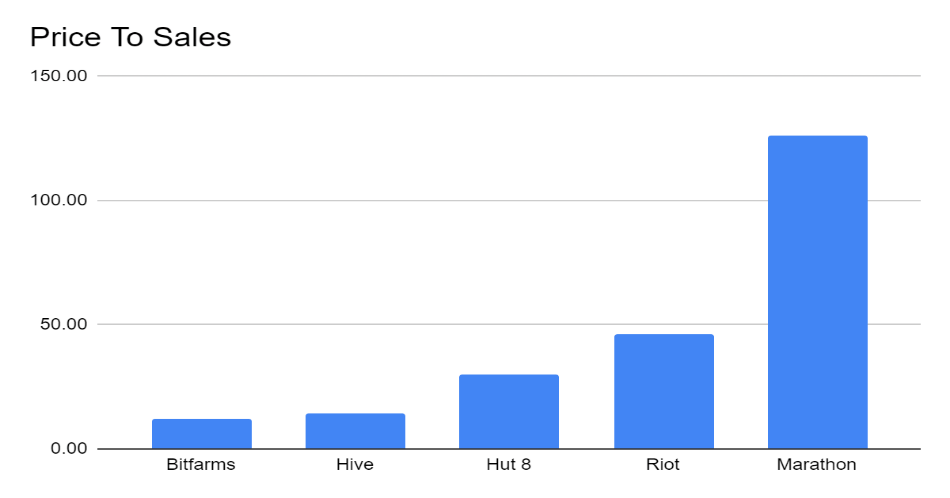
Chart produced by author using data from SA
From the data, we get the following table for Riot.
| Revenue | Multiplier | Market Cap |
| 65,300,000 | 46.25 | 3,020,000,000 |
Table produced by author using data from SA
I would say that a more sophisticated measure of value is the enterprise value-to-revenue multiple (EV/R), and many investors use this ratio to ascertain whether a stock is fairly priced or not. For my calculations, I have taken basic figures from SA and, without doubt, more refined figures could be obtained. For instance, it might be possible to get data on the “fair” value of the debt, then input these numbers into the formula. Again, the lower the number, the better the value.
The basic ratio is calculated as described below:
EV= Market capitalization + Total debt – Cash and equivalents (CC)
Divided by revenue
From the table, you can see that the figures are little changed.
| Market Cap/ Revenue | EV / Revenue | MC | Debt | CC | Revenue | |
| Bitfarms | 12.37 | 12.31 | 1,030 | 30.3 | 36.2 | 83.2 |
| HIVE | 14.38 | 14.57 | 1,400 | 52.7 | 35.5 | 97.3 |
| Hut 8 | 30.14 | 29.20 | 2,020 | 11.5 | 74.8 | 67.0 |
| Riot | 46.24 | 46.56 | 3,020 | 192.2 | 172 | 65.3 |
| Marathon | 117.66 | 109.68 | 4,930 | 3.3 | 337.5 | 41.9 |
Chart produced by author using data from SA
Profitability
A common metric used is Return on Assets (ROA), which, as the name suggests, is an indicator of how profitable a company is relative to its total assets. This ratio gives a stockholder an indication about how efficiently a company is utilising its assets to produce earnings for shareholders. The formula for this ratio is Net Income / Total Assets. For this ratio, as before, I have calculated the figures for the most recent four quarters. Needless to say, for ROA, the bigger the number, the better.
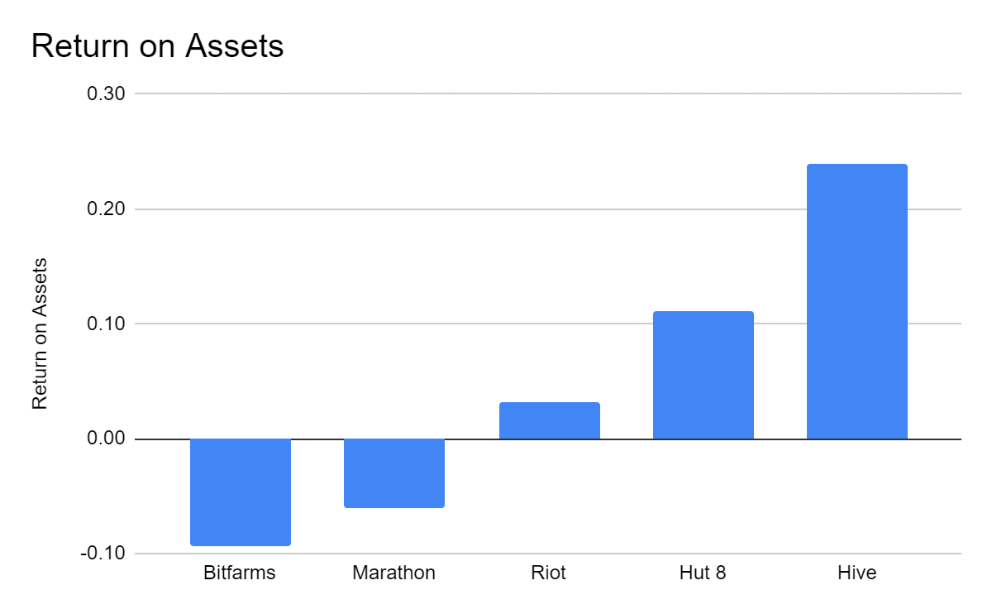
Chart produced by author using data from SA
We can only guess at the myriad potential reasons behind the huge differences in Return on Assets for all these five companies. However, it is possible to put forward a reasonable hypothesis for one of the differences between HIVE and Riot.
From the graphic below, it’s clear that a large percentage of the running costs is used to pay for the electricity needed to cool equipment. So, if you have your mining operation somewhere hot, such as Texas, you are going to use a lot more power. On the Riot website, the company states that their facility in Texas needs 200 MW for their new immersion cooling technology. Frankly, If I were a CEO of a Bitcoin mining operation, I would much prefer to buoy the confidence of investors by stating that a fancy cooling system was unnecessary as our mining operations are in cool locations, which is the case with both HIVE and Hut 8.
Pie chart showing data centre energy use
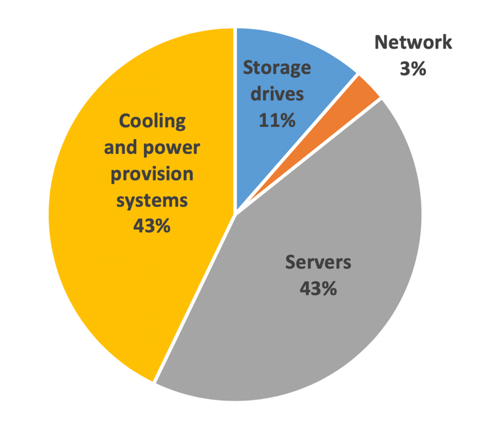
Graphic provided courtesy Energy Innovation
Management excellence
Most readers will be familiar with the popular measure of management effectiveness; Return on Equity (ROE). This metric connects the earnings produced by a company to the stockholder’s investment. To calculate ROE, it is a relatively simple matter of dividing a company’s net income by the shareholders’ equity.
It’s generally established that a good ROE is around 15% while a mouth-watering figure is about 25%. Actually, by some estimates, the average ROE for S&P companies in Q 3 this year was around 24.36%, which may have contributed to the S&P reaching new highs.
So, for the miners under consideration, we get the following table.
| Bitfarms | Marathon | Riot | Hut 8 | HIVE | |
| ROE | -10.70% | -5.63% | 4.06% | 11.60% | 30.35% |
Table produced by author using data from SA
The table requires little explanation, as it is clear that Riot is a long way behind the leader in terms of ROE.
Particularly for companies in an expansion phase, canny investors pay special attention to Return on Invested Capital. This calculation is used to gauge a company’s competence at apportioning capital for profit. Without doubt, wise investors place their trust in companies that get more bang for their buck, so to speak.
The formula I have used is as follows:
ROIC = NOPAT / Invested Capital
NOPAT = EBIT *(1- Tax Rate)
Invested Capital = Net Working capital + Net Plant Property and Equipment (PP&E) + Goodwill
Inputting the data of the last four quarters for Riot, and the table given below was generated. As you can see, the data gives a figure of 10.28%
| EBIT | 32.8 |
| Tax rate | 0.00% |
| NOPAT | 1.0 |
| Current Assets | 221.3 |
| Current Liabilities | 37.5 |
| NWC | 183.8 |
| PP&E | 135.3 |
| Goodwill | 0 |
| Invested Capital | 319.1 |
| ROIC | 10.28% |
Table produced by author using data from SA
Using the exact same formula and data source, the figures for the other companies are shown below.
| HIVE | Riot | Hut 8 | Marathon | Bitfarms |
| 35.64% | 10.28% | 8.78% | -5.75% | -15.96% |
Table produced by author using data from SA
For Riot stockholders, it must be nice to see that the company’s ROIC is positive, but even the most ardent supporters of the company would agree that the figure is hardly breathtaking in comparison to HIVE.
Cautionary notes
The ratios given strongly suggest that Riot is far from the best option when it comes to Bitcoin miners, however, it must be remembered that these ratios give a snapshot of the present and the picture could change dramatically following the next quarterly results, which are around the corner.
Before investing in the Bitcoin ecosystem, I spoke to several people who had purchased a number of these coins to explain its value. With a kind of patriotic fervour, they pointed out in terms that a simpleton like me could comprehend, that there was a limited supply of Bitcoin, and it is one of the reasons for the rocketing price. But that’s not true, is it? Visit the investor relations section of the companies listed then read some of their blurbs and you will discover just how many brand-new Bitcoins they boast about producing daily. And the list of miners I have given is by no means exhaustive. Furthermore, I imagine there are also mom-and-pop operations going on all over the world, with garages stuffed to the gunnels with Bitcoin making machines. This inevitably leads to the thought that, in time, supply may begin to match demand and the price of Bitcoin may begin to fall (Notwithstanding the theoretical limit of 21 million Bitcoins that can potentially be produced). Given that Bitcoin has recently hit all-time highs, I suspect we are a long way off this point though.
According to some who closely follow the production of Bitcoin, as of August of this year, 18.77 million bitcoins had already been mined. So, the battle is on to introduce the remaining 2.3 million or so. Once these coins have materialized, investors may rightly wonder how these companies will generate profits.
Full disclosure, as some readers may have already guessed, I am long HIVE Blockchain Technologies.
Disclosure: I/we have a beneficial long position in the shares of HIVE either through stock ownership, options, or other derivatives. I wrote this article myself, and it expresses my own opinions. I am not receiving compensation for it (other than from Seeking Alpha). I have no business relationship with any company whose stock is mentioned in this article.
Reprinted from Seeking Alpha
Update: Northern Data AG (and Riot Blockchain) engage in accounting fraud?, read more here.
Riot’s Cost Structure Cites Massive Overvaluation, read more here.
Chad Harris defaults on million dollar loan, click here to learn more. Be sure to read the court doc. It’s a hoot, He tries to play the victim. The judge ain’t buying it.
Chad Everett Harris owned this business while defaulting on loans and invoices. Click here to learn more.
Chad Harris sent email like these to the people he owed money to.